Year: 2024
Topic: Kinetic Theory
Time :
1.
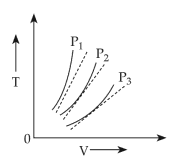
The following graph represents the T - V curves of an ideal gas ( where T is the temperature and V the volume ) at three pressures P1 , P2 and P3 compared with those of Charles's law represented as dotted lines .